
The ten graphs which show how Britain became a wholly owned subsidiary of the City of London (and what we can do about it)

Of all the charts I produced for my new book Can we avoid another financial crisis? (Keen 2017), the one that surprised me the most was the one showing British private sector debt relative to GDP.
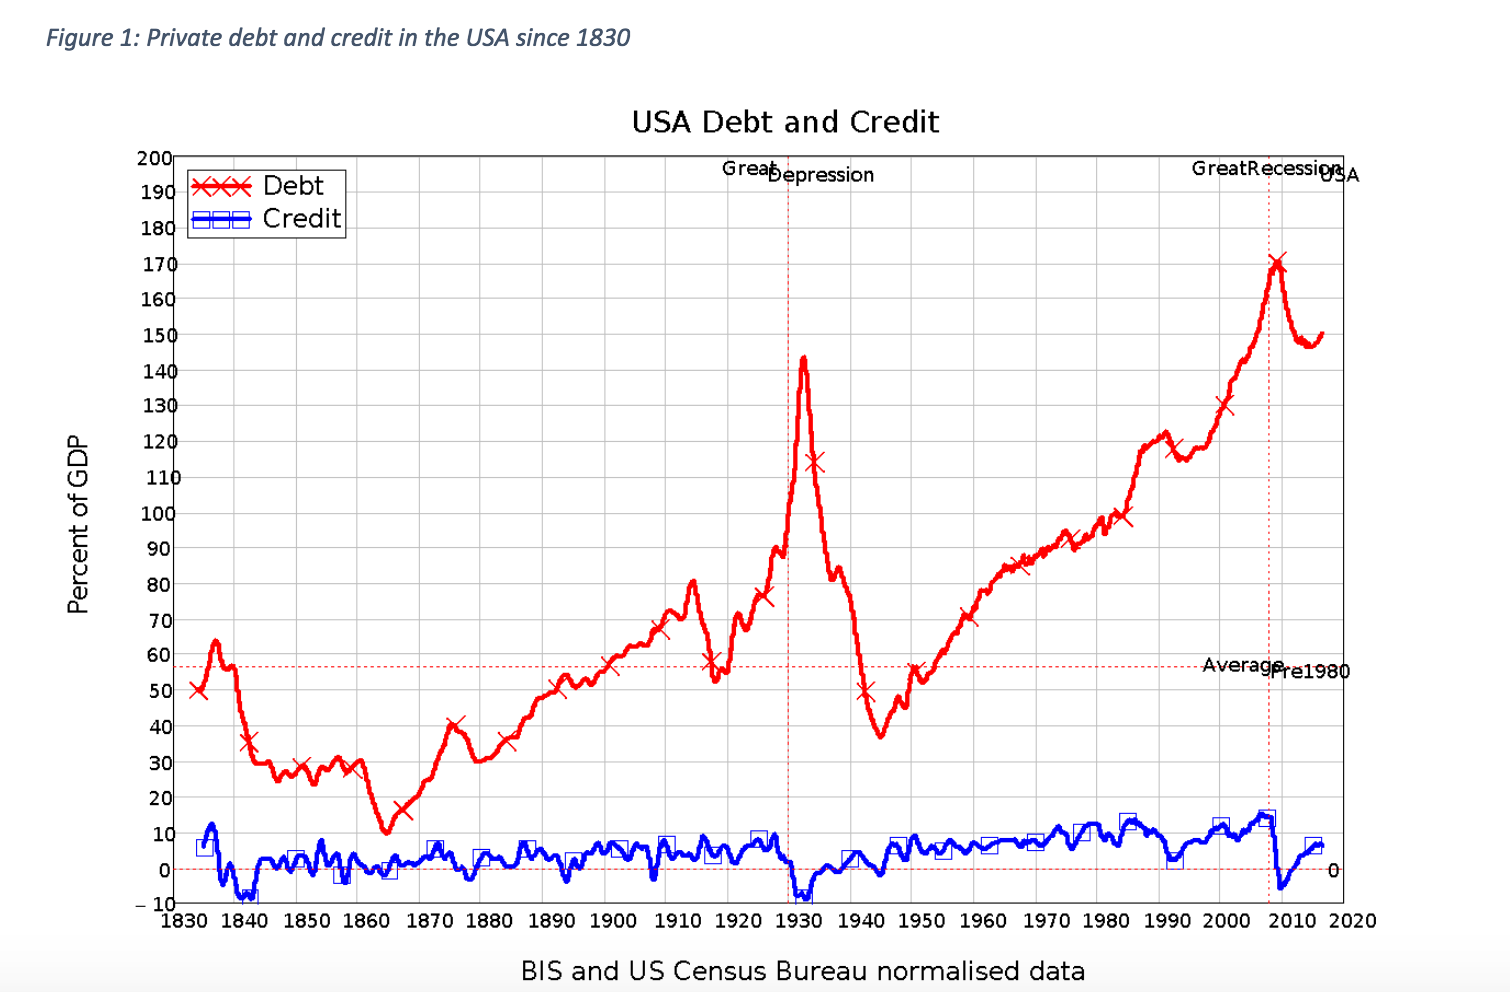
The American data showed a perennial tendency for private debt to grow faster than GDP, followed by financial crises in which debt was written off, only for the process to repeat itself later on. Figure 1 shows the level of private debt as a percentage of GDP in red, and credit – which is the annual change in debt—in blue. There were regular occurrences of negative credit, and therefore a falling ratio of debt to GDP, but the apparently inexorable trend in the USA was for debt to rise relative to GDP until a serious crash occurred.
I expected a similar pattern for the UK. Instead, I saw the pattern in Figure 2. There was no trend in UK private debt to GDP until shortly after the election of Margaret Thatcher. Then, under both her rule and Tony Blair’s, the private debt to GDP ratio more than trebled in less than 30 years.
Figure 2: Private debt and credit in the UK since 1880
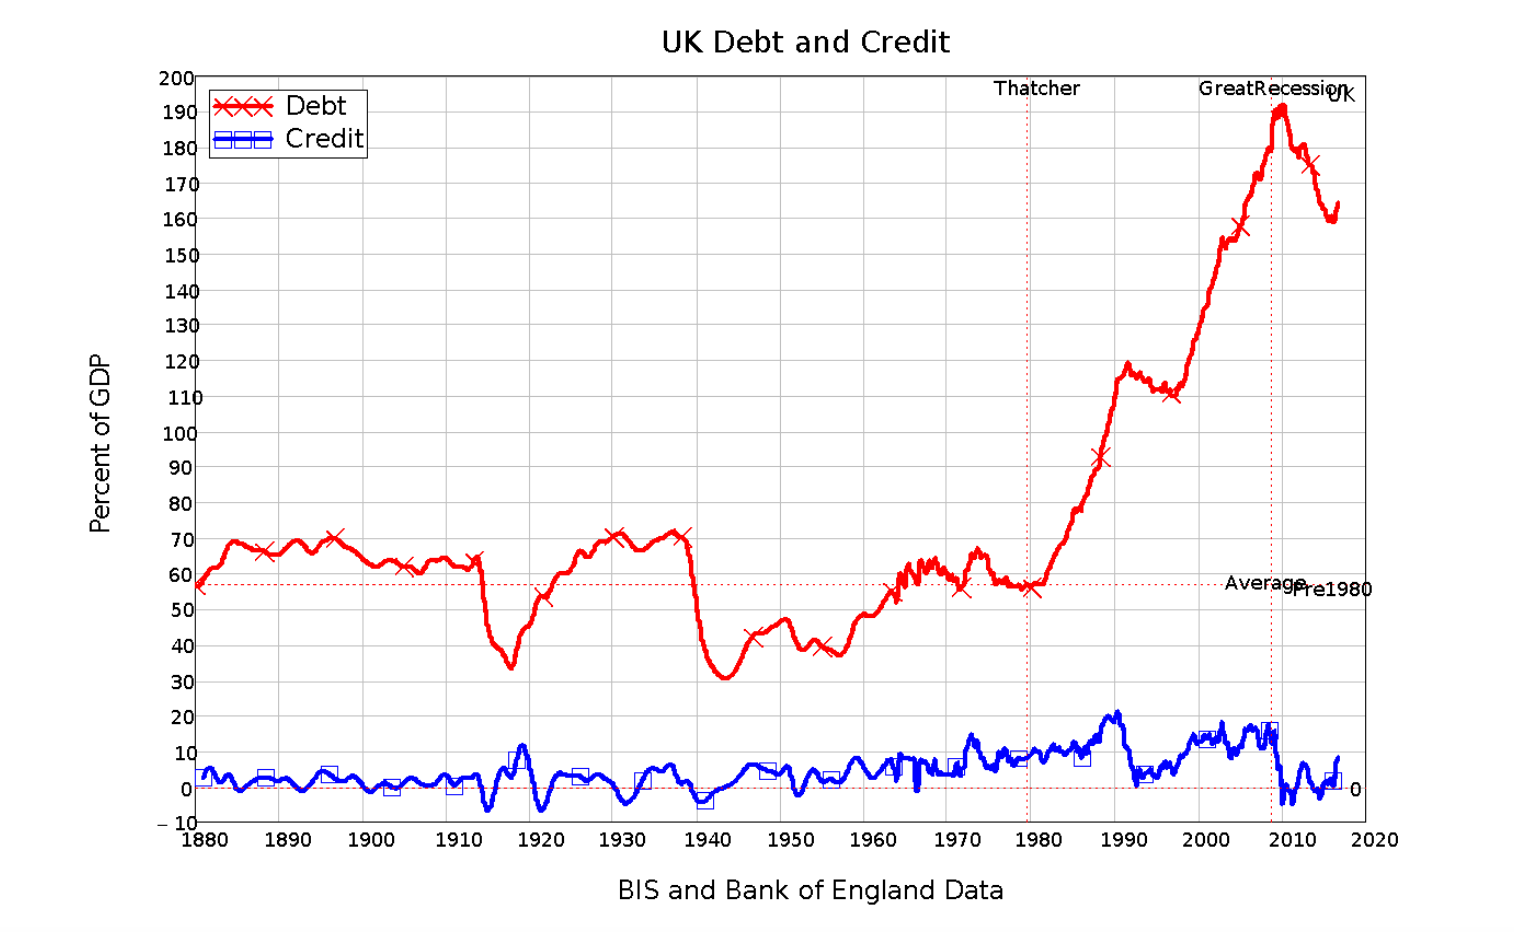
Private debt never exceeded 72% of GDP in the century from 1880 (when the Bank of England’s time series begins) till 1980, and its average value was 57% of GDP. By 2010, when it peaked, private debt had risen from under 60% of GDP to almost 200%. If any chart lets us date when Britain’s economy started to become seriously unbalanced, this is it. The decline in manufacturing had commenced much earlier, but the unconstrained ascendance of finance began in 1981. This was the date on which Britain started to become a fully owned subsidiary of the City of London.
This growth in debt gave The City immense power over the rest of the country, in a Faustian bargain that delivered ever growing demand from credit (which is equal in magnitude to the annual increase in private debt) in return for an ever-growing claim by The City on the assets and incomes of the rest of the country.
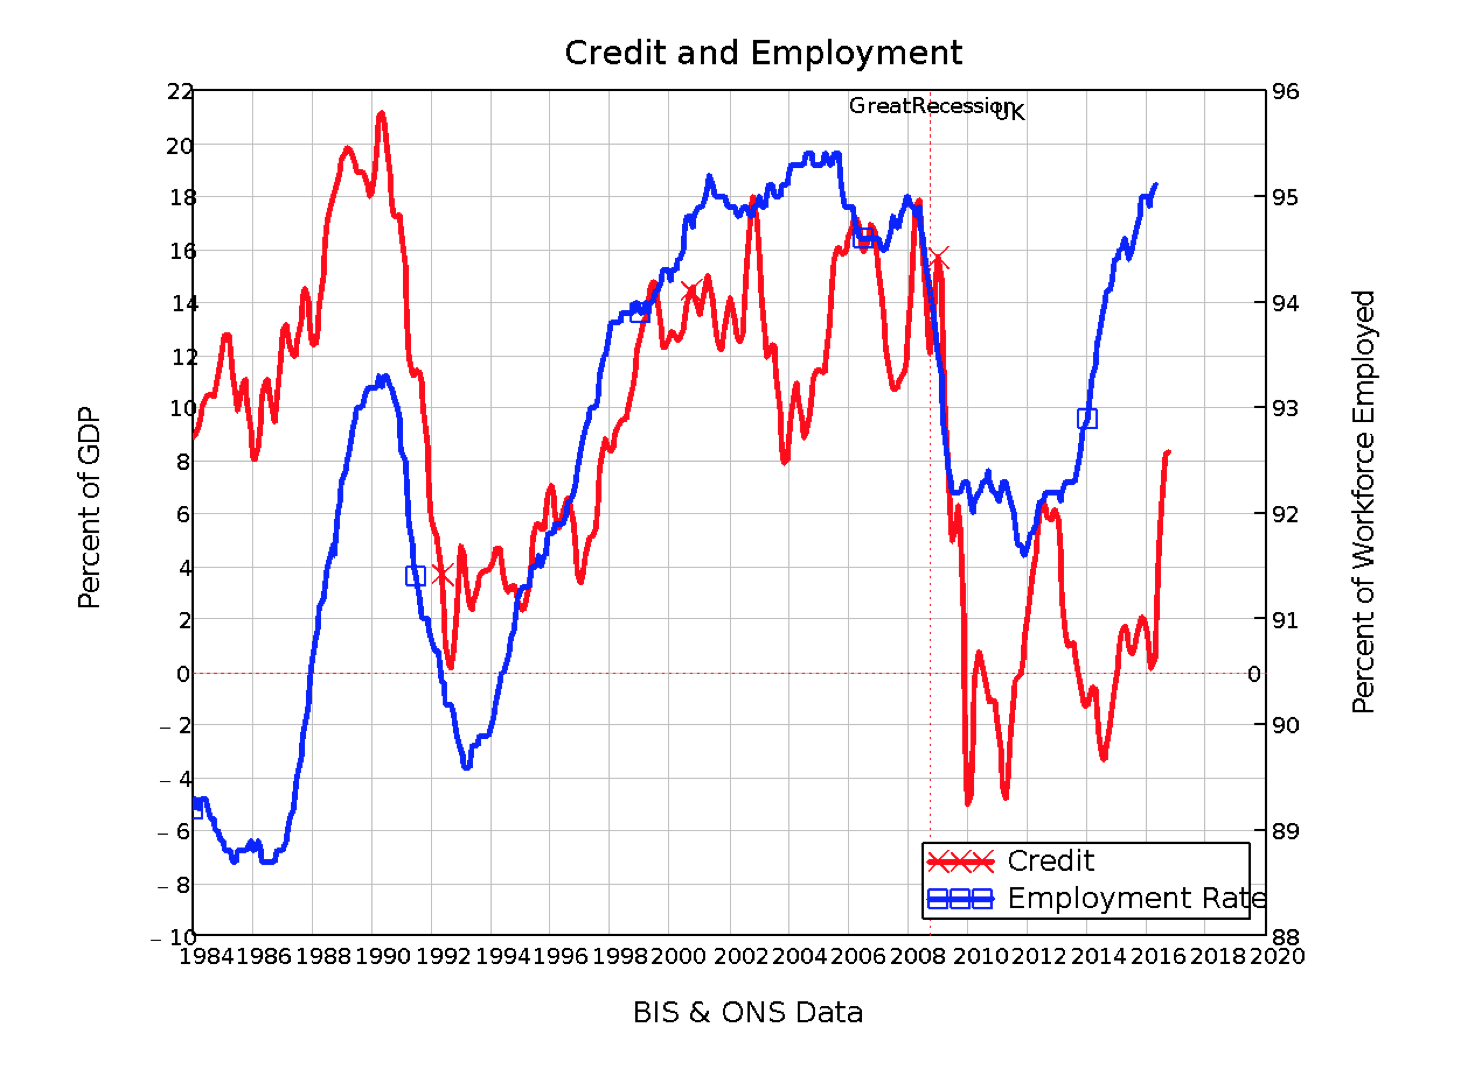
For a while, this bargain felt win-win for both sides: as the Bank of England recently acknowledged, bank lending creates money at the same time as it creates debt (McLeay, Radia et al. 2014). This money is then spent, either to buy assets, or goods and services. It therefore adds to total demand, and to incomes and capital gains. So, as banks created “money from nothing”, and the UK private sector spent that money that it got for doing nothing, prosperity seemed to abound. The rising credit-based demand substituted for the decline in demand from actually producing goods and services, and the additional financial claims against the UK’s physical resources grew from a relatively low level. The decline in manufacturing employment was offset by a rise in employment in finance, where the main output was not goods but credit-based money and its Siamese twin, debt. While the debt continued to grow, it boosted both economic activity (see Figure 3) and asset prices (see Figure 4).
Figure 3: As private debt grew, employment in Britain became more dependent on credit
But you can’t have very high levels of credit-based demand without the corollary of an ever-increasing level of debt relative to income. More and more of income is required to service this debt, cutting into spending on goods and services. The turnover of existing money slows down, reducing aggregate demand from actual work, while increasing the dependence on credit.
This dependence is all the more dangerous when that money is used not to finance consumption or investment (both of which at least to some extent generate a greater capacity to service debt by increasing demand, and, in the case of investment, also increasing productive capacity) but to finance speculation on asset prices. That, overwhelmingly, is the use to which most of this additional money has been put. This can lead to gains by individual borrowers if asset prices rise sufficiently to mean they can sell their debt-purchased assets for a profit. But it doesn’t increase the productive capacity of the economy one iota: a more expensive house doesn’t produce more intelligent children, and a higher share price doesn’t boost a company’s productivity (though it can indirectly boost its capacity to raise funds for investment).
Debt-financed asset purchases are thus fundamentally a Ponzi activity: though initially the income stream from a debt-financed speculative purchase may exceed the debt-service costs, the increase in debt isn’t matched by any increase in productive capacity. The trend, as debt to GDP rises, is for the debt servicing costs to overtake the income earning capacity of the asset, so that ultimately the only means of profit for the borrower is to sell the asset on a rising market. Between sales, the borrower is losing money, as the cash flow from the asset is less than the servicing costs on the debt that was used to finance it.
There are not one but two Faustian catches to this deal with the devil of debt. The trickier catch is that the rise in asset prices that sucks people into Ponzi borrowing in the first place is actually driven by the borrowing itself. In the housing market, new mortgage debt is by far the major source of monetary demand for housing, so that there is a link between the new mortgage debt and the level of house prices. This leads to a causal link between the change in new mortgages and the change in house prices (see Figure 4). So it’s not the level of mortgage debt that affects house prices, nor even its rate of change (which is equivalent to net new mortgages), but the rate at which that rate of change is changing: its rate of acceleration.
Even though we experience it all the time while driving, riding in trains, or flying, acceleration is a tricky thing for mere mortals to comprehend. It’s quite possible for acceleration to be falling while velocity is still rising, and for acceleration to be rising while velocity is falling (see Figure 4 for an illustration).
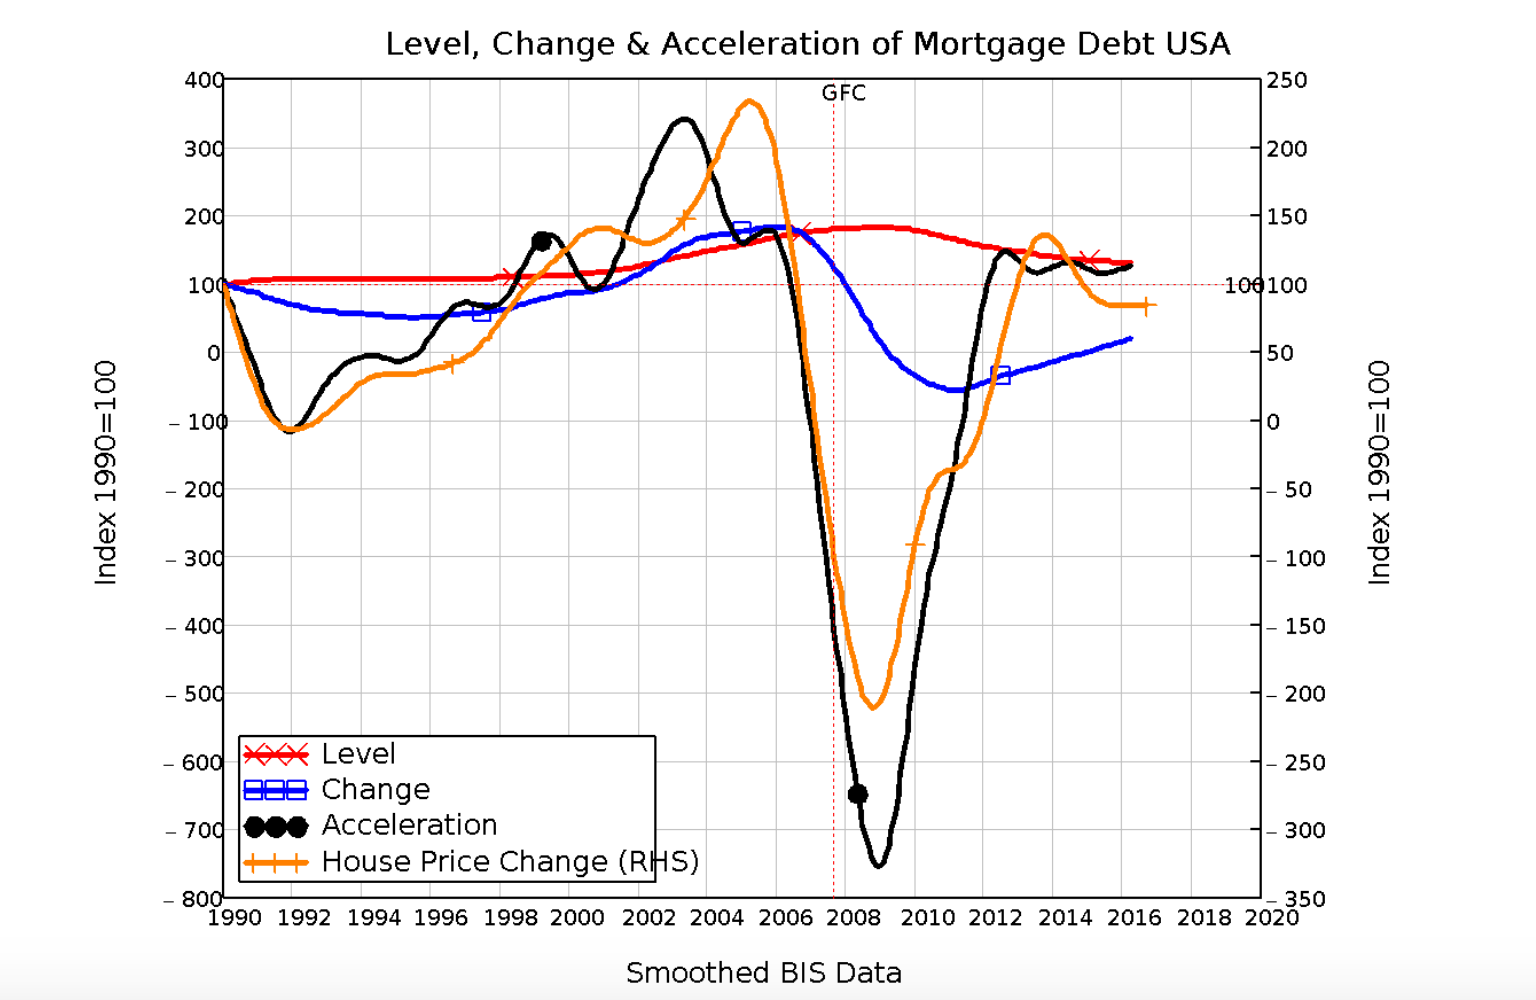
Figure 4: Relationships between level of debt, credit & change of credit
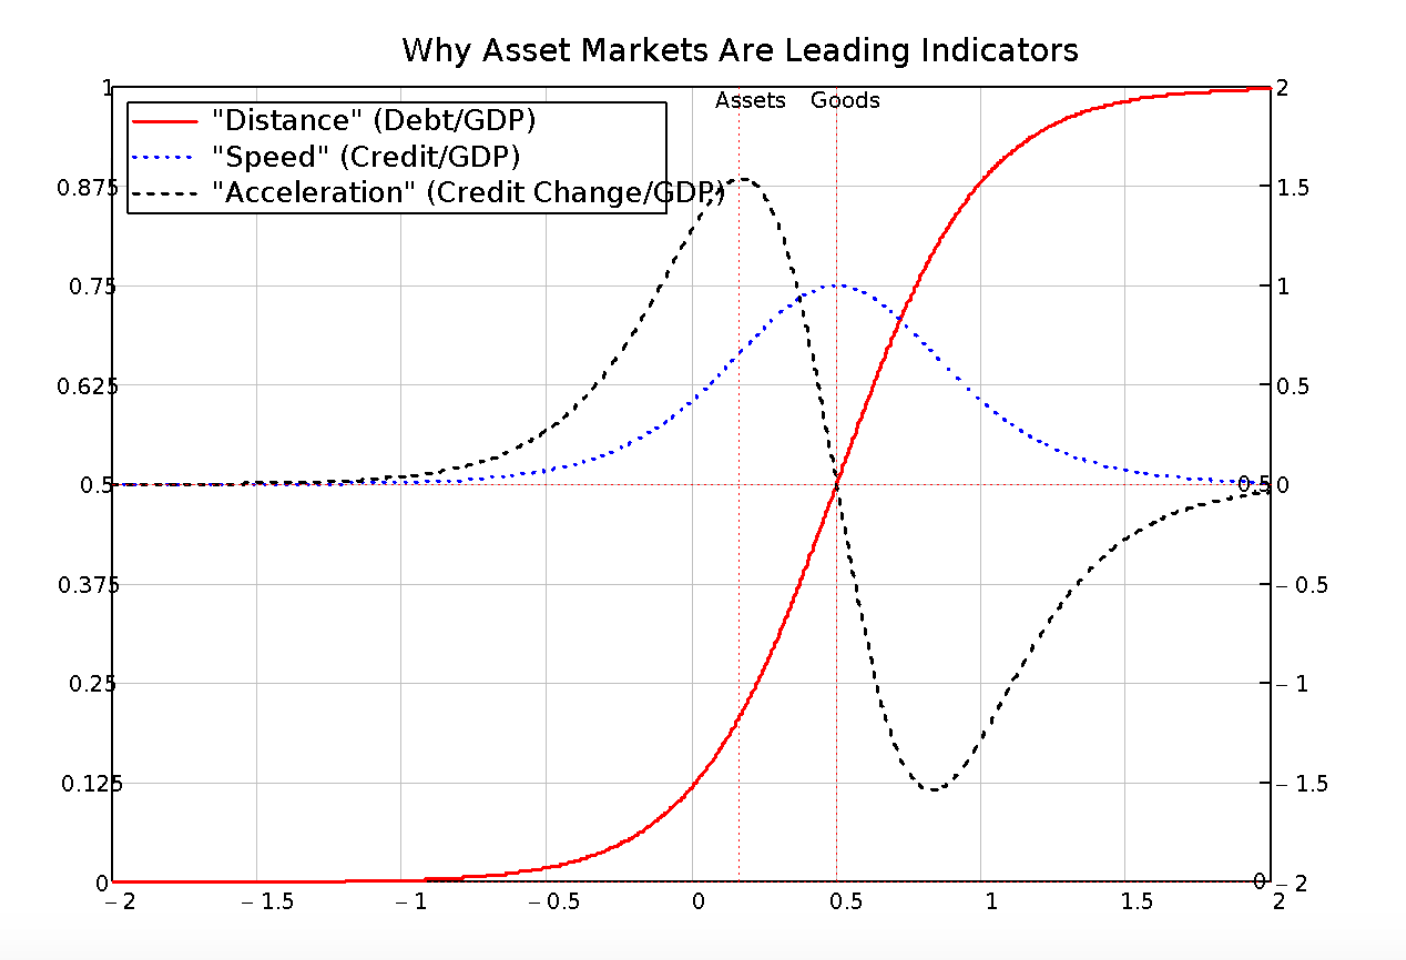
The same can and does happen with mortgage debt: it can decelerate while the change in mortgage debt is still rising, and it can accelerate while the change in mortgage debt is falling.
This trick starts the house price/debt spiral: a boom can commence even when mortgage debt is falling relative to GDP, because it is falling more slowly and therefore accelerating. But it then traps us at the other end, since mortgage debt can decelerate even though it is still rising.
Figure 5: The major determinant of changes in house prices is the change in mortgage credit (Correlation 0.8)
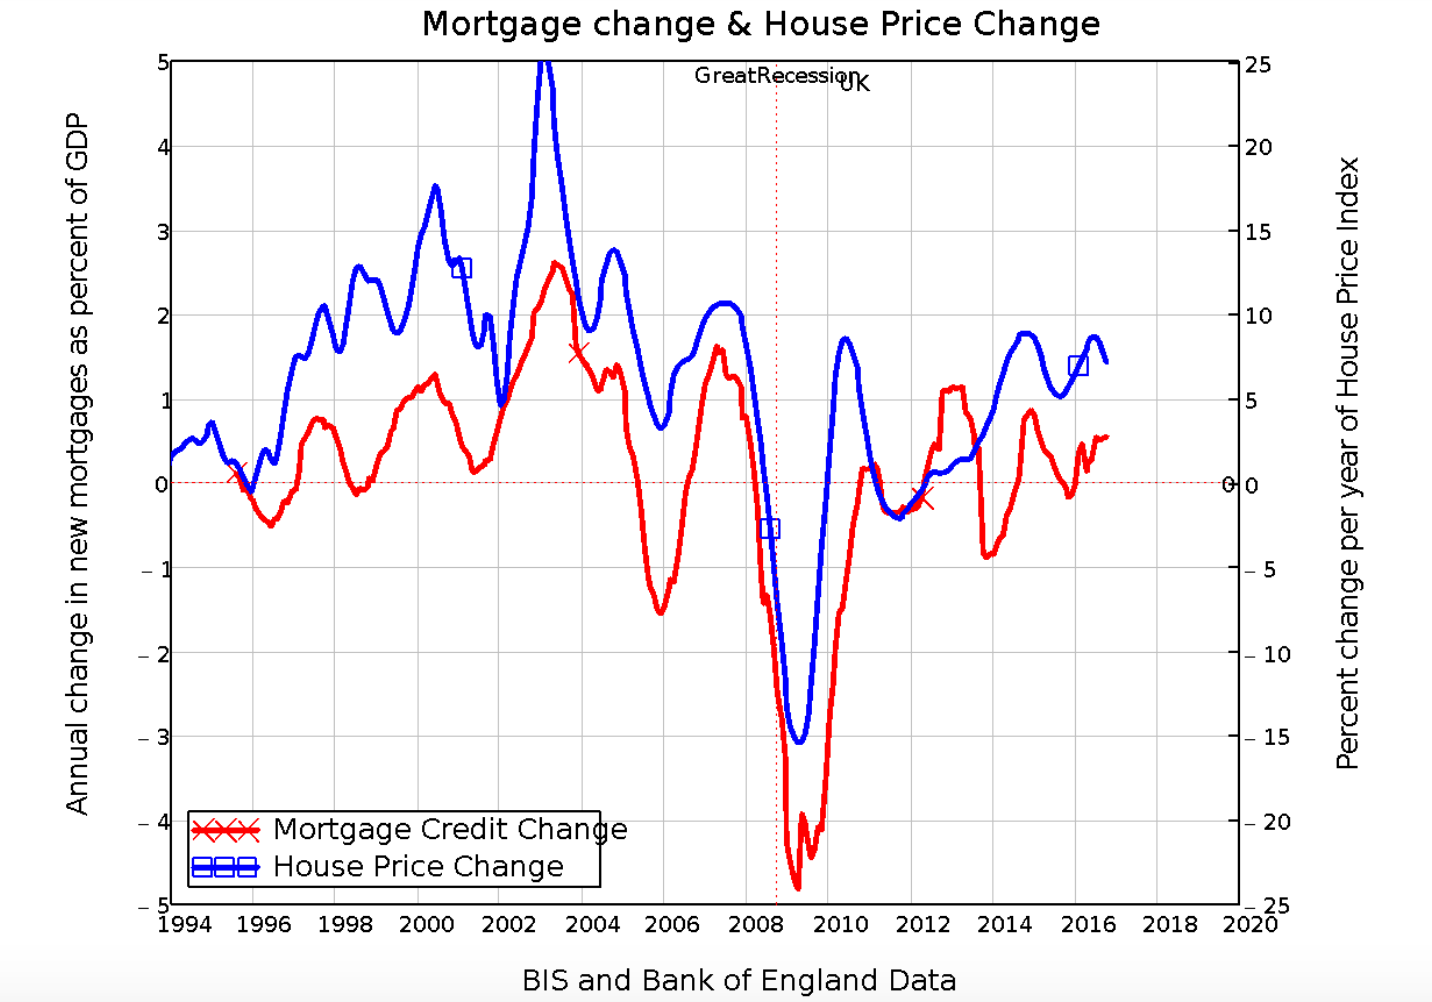
Confused? That’s the point. This mechanism is so confusing that it’s easier for policy makers to not even think about it, and blame rising house prices on tight supply alone. But in fact, it’s rising mortgage credit (which is accelerating mortgage debt) that drives prices, as Figure 5 illustrates using US data. The deceleration of mortgage debt also necessarily precedes the decline in credit, crashing asset markets before the economy itself tanks.
Figure 6: Asset markets crash before the economy does because debt acceleration declines before credit does
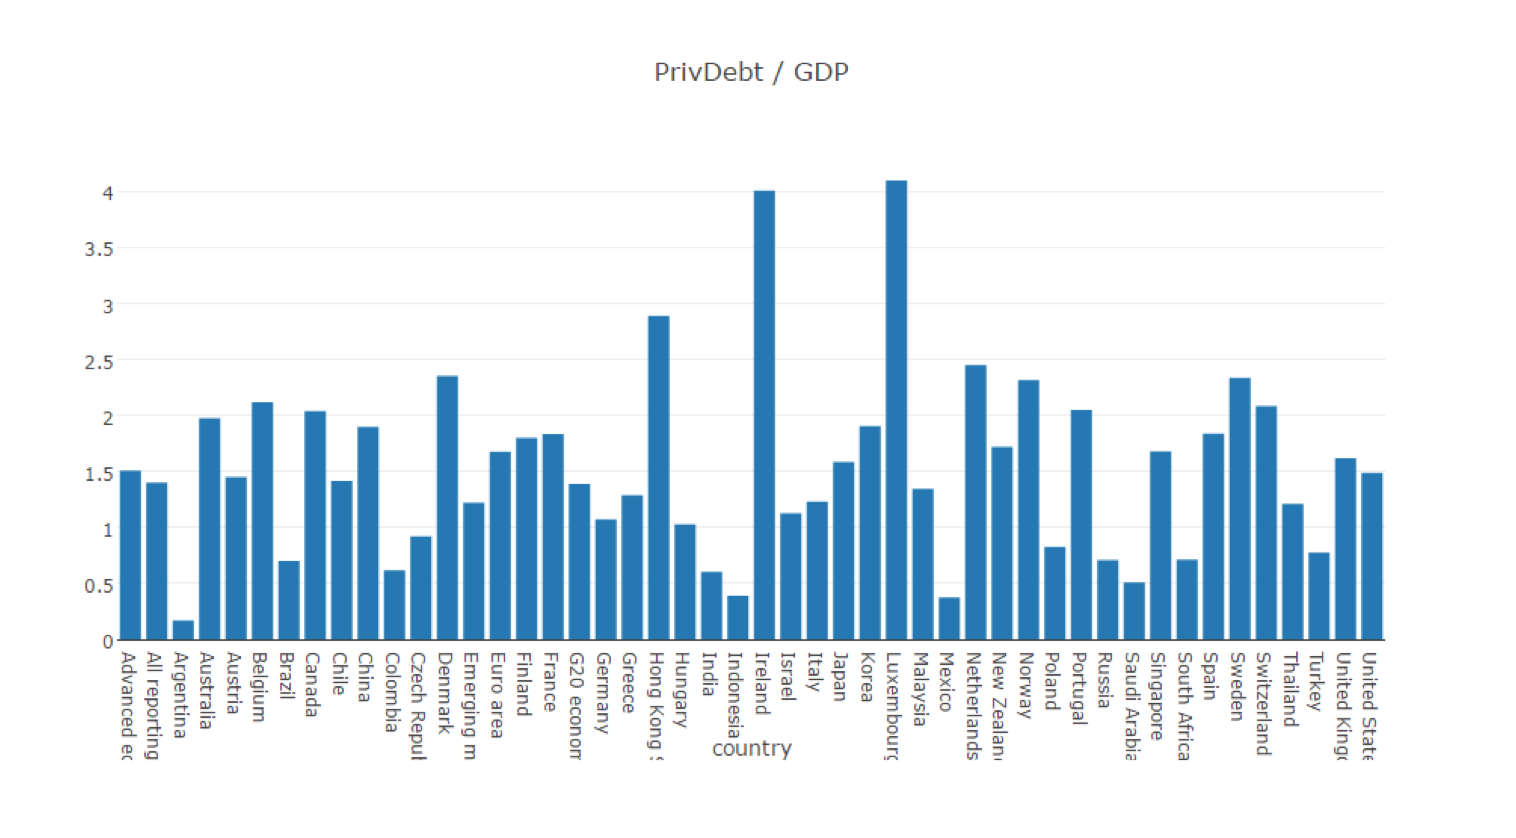
So why can’t debt keep accelerating forever, and keep the house price bubble and the economy going? This is where Faust’s second catch comes in: ultimately, there is a limit to just how much debt individuals and corporations can take on – even with low interest rates. For most economies, apart from tiny and tax-dodge-dependent states like Luxembourg (population 300,000), Ireland (5 million) and Hong Kong (7 million), that limit appears to be about 2.5 times GDP – see Figure 6. Japan peaked at 220% in 1993 and has since fallen to 150%, Spain hit 220% in 2010 and is now at 170%, while the USA peaked at 170% in 2008 versus 150% now. The Netherlands, the absolute private debt to GDP record holder amongst economies with more than 10 million people, peaked at 247% of GDP in 2010 and is now at 236%. The UK’s peak was 192% in 2010, and it is now 164%. The borrowing ultimately stops.
Figure 7: Private debt to GDP levels in September 2016. BIS Data
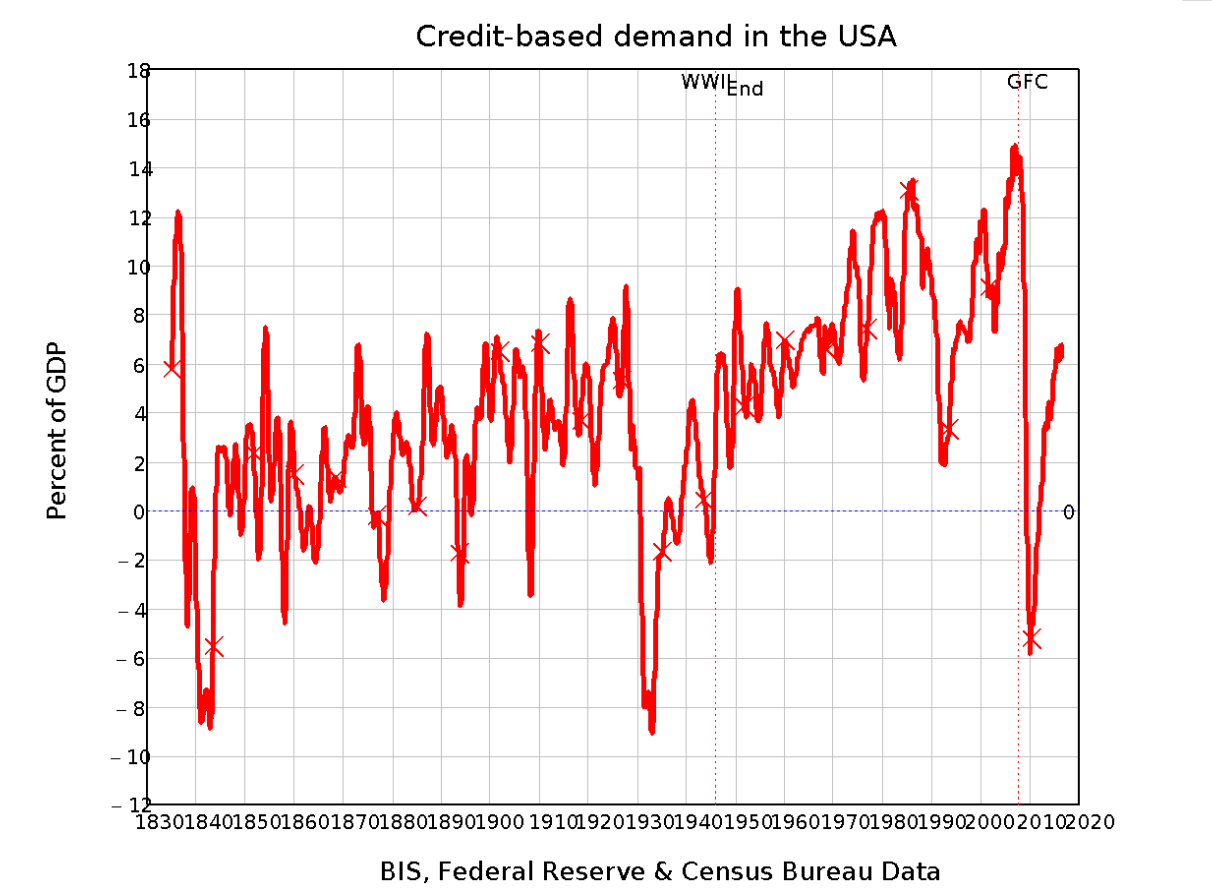
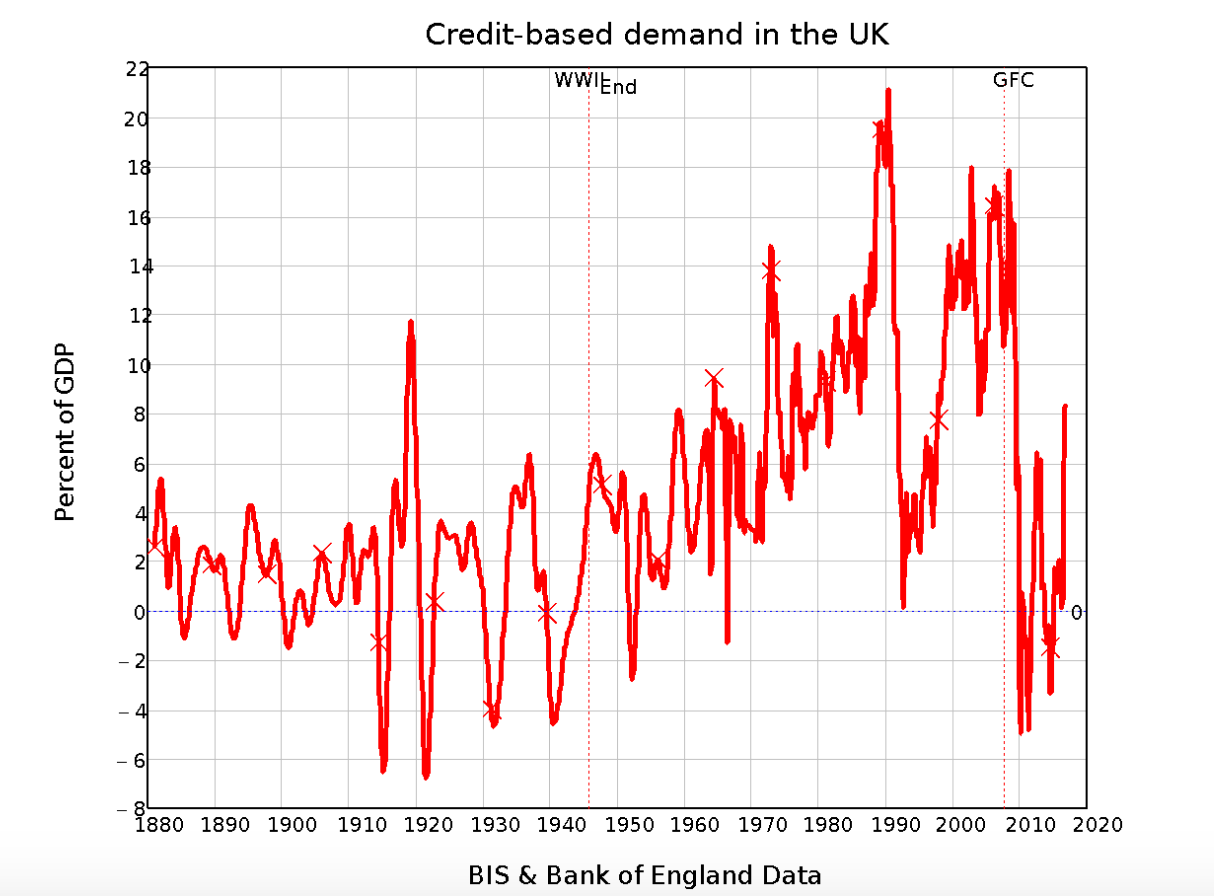
Then credit-based demand not only drops, it can turn negative when debt is very high relative to GDP, thus suddenly reducing demand rather than increasing it. This is why the 2008 crisis was so severe compared to our post-WWII experience. For the USA, it was the first time that credit had been negative since WWII ended (see Figure 7); it was the third such event for the UK, but the first in over 50 years, and much larger and longer than the downturns in 1952 and 1966 (see Figure 8).
Figure 8: Credit demand was regularly negative before WWII, rarely so afterwards
Faust’s final trap after the crisis is that, with private debt still so high relative to incomes, the capacity to generate more demand through credit is severely restricted. Though private debt today is about 30% of GDP below the peak reached in 2009, it is still close to three times the pre-unbalancing average. At that level, credit-based demand can’t expand greatly without returning the UK to its peak level. So, credit-based demand can never reach its previous highs, and the economy remains mired in a slump.
The crunch for the UK economy came in September 2008, when credit-based demand started to fall, from 12.4% of GDP then to minus 5% of GDP in 2010. Here the malaise finally afflicts the Doctors of Debt themselves: with anaemic credit-based demand, the capacity of the finance sector to profit from expanding debt diminishes rapidly.
Table 1: Credit demand after the 2008 slump is the lowest it’s ever been in peacetime in the UK
| Time Period | Debt % GDP | Average Credit % GDP |
| 1880 till Great Depression (End of 1929) | 70.1 Maximum | 1.6 |
| 1930 till 1945 | 71.4 Maximum | 0.4 |
| 1945 till June 1981 | 66.7 Maximum | 5.3 |
| June 1981 till Great Recession (September 2008) | 191.9 Maximum | 10.8 |
| Great Recession till Now | 164.3 Current | 1.1 |
The internal finance-sector gambling that was a positive sum game for all participants as debt rose becomes a zero-sum game, or close to it. If the parasite almost kills the host, the parasite suffers too. Only QE kept The City afloat as government policy witlessly rescued the parasite in the belief that this would help revive the host.
Figure 9: Credit demand was regularly negative before WWII, rarely so afterwards
It did to some extent: the initial £200 billion in QE probably boosted actual GDP by about one-fifth that much, as capital gains from a QE-fuelled stock market were poured mainly into yet more housing speculation and a tiny amount of consumption by stockholders. But this policy has maintained all the imbalances that expanding credit created in the first place: finance sector employment is far larger than it needs to be, assets remain over-valued compared to incomes, and the private debt burden that caused these imbalances remains far too high.
A fundamental pre-requisite to rebalancing the economy is to return the private debt to GDP level to where it used to be before belief in the false prophets of Neoliberalism led us into this debt trap. That could be done by “QE for the People” modified by the requirement that QE recipients must first pay down their debts. Much more is needed, but if that isn’t done then many other remedies – such as trying to boost UK manufacturing via a lower exchange rate – are likely to fail.
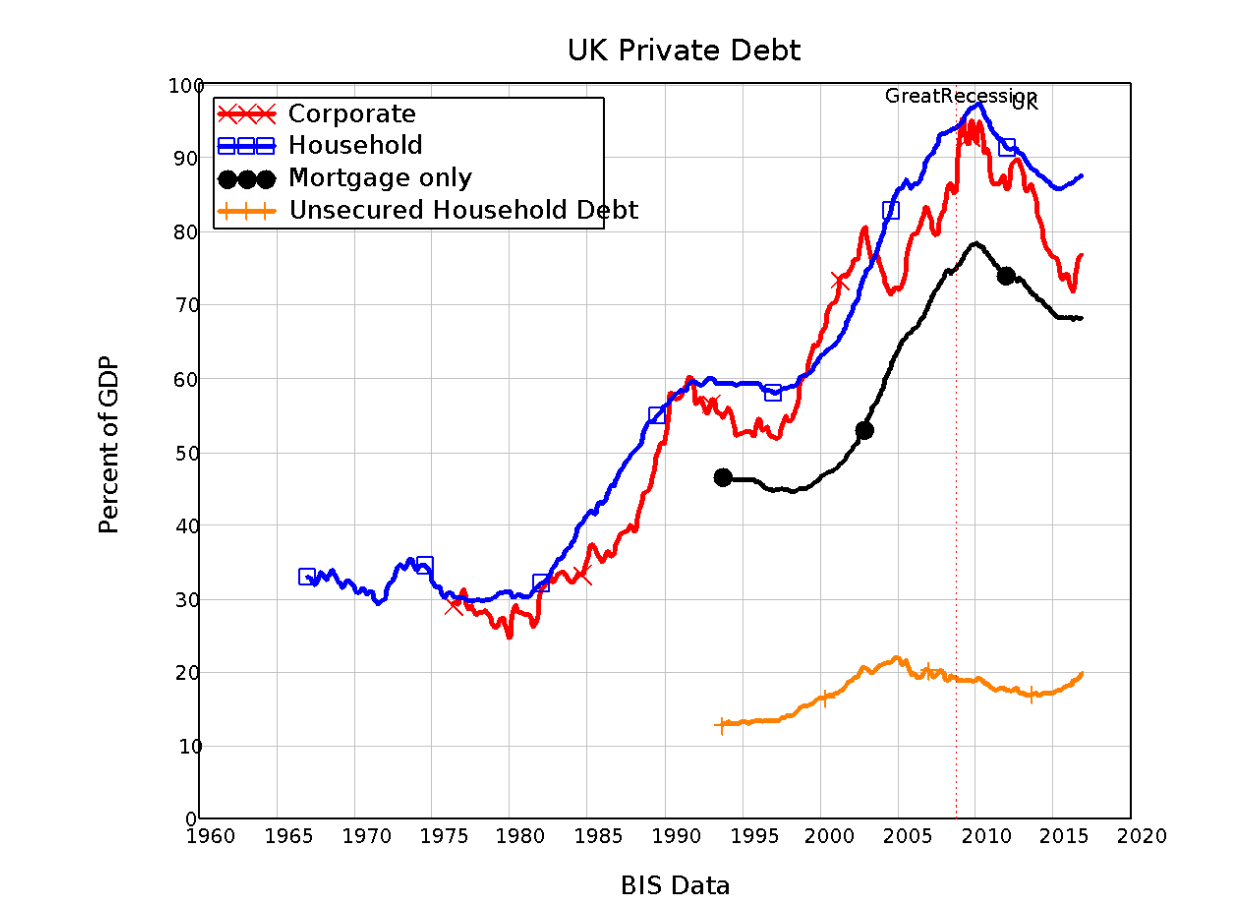
Figure 10: Both households and corporates have driven the debt binge
Postscript: The wanton ignorance of mainstream economists
Conventional economists like Paul Krugman continue to deny that there is any link between credit and economic activity, arguing that any increase in spending power for debtors out of credit must be offset by a decline in purchasing power by those who lend to them, so that in the aggregate credit has very little impact on the macroeconomy:
But, but, you say — that’s not where the debt comes from. It comes from people spending more than they earn. And that’s true — debtors get there by spending more than they take in. But creditors get there by spending less than they take in. (Krugman 2015)
The problem with private debt is that we have good reason to believe that in very wide-open financial systems people get irrationally exuberant, lending and borrowing to an extent that they eventually realize was excessive — and that there are huge negative externalities when everyone tries to deleverage at once. This is a very big problem, but it’s not about generalized excess consumption. (Krugman 2015)
This belief could be excused when the literature on banks creating money “out of nothing” lived in the underground of economics. But after the Bank of England explicitly rejected this “Loanable Funds” model of banking as a fantasy, the days when mainstream economists could hide behind it disappeared. But still they continue to do so.
The fallacy in their thinking is easily demonstrated by looking at the two types of lending – from one non-bank agent to another (Loanable Funds or LF) and by a bank to a non-bank (Bank Originated Money or BOM as an accountant might call it).
A “Loanable Funds” loan simply shuffles existing money from one person’s bank account to another: no new money is created (row 1 in Table 2). A “Bank Originated Money” loan creates a new asset for the Bank, and creates new money as well – which the recipient then spends.
Table 2: Comparing Loanable Funds and Bank Originated Money
| Action | Assets | Liabilities (Deposit Accounts) | Change in Money | |
| Bank Loans | Saver | Borrower | ||
| 1. Loanable Funds | -LF | +LF | No change | |
| 2. Bank Originated Money | +BOM | +BOM | +BOM | |
The former operation doesn’t create any additional demand, as Krugman asserts. But the second operation does – and this is what he is now wilfully ignoring by failing to comprehend the macroeconomic implications of Bank of England’s clear statement of real world banking (Krugman 2014).
Figure 10: Krugman’s blog where he fails to comprehend the macroeconomic implications of “Money Creation in the Modern Economy”
Nobel prizes should be harder to earn than that.
References
Keen, S. (2017). Can We Avoid Another Financial Crisis? (The Future of Capitalism). London, Polity Press.
Krugman, P. (2014). “A Monetary Puzzle.” The Conscience of a Liberal http://krugman.blogs.nytimes.com/2014/04/28/a-monetary-puzzle/.
Krugman, P. (2015). “Debt Is Money We Owe To Ourselves.” New York Times https://krugman.blogs.nytimes.com/2015/02/06/debt-is-money-we-owe-to-ourselves/?_r=0.
Krugman, P. (2015). “Debt: A Thought Experiment.” New York Times https://krugman.blogs.nytimes.com/2015/02/06/debt-a-thought-experiment/.
McLeay, M., A. Radia and R. Thomas (2014). “Money creation in the modern economy.” Bank of England Quarterly Bulletin 2014 Q1: 14-27. http://www.bankofengland.co.uk/publications/Pages/quarterlybulletin/2014/qb14q1.aspx.
Support Steve Keen on Patreon.